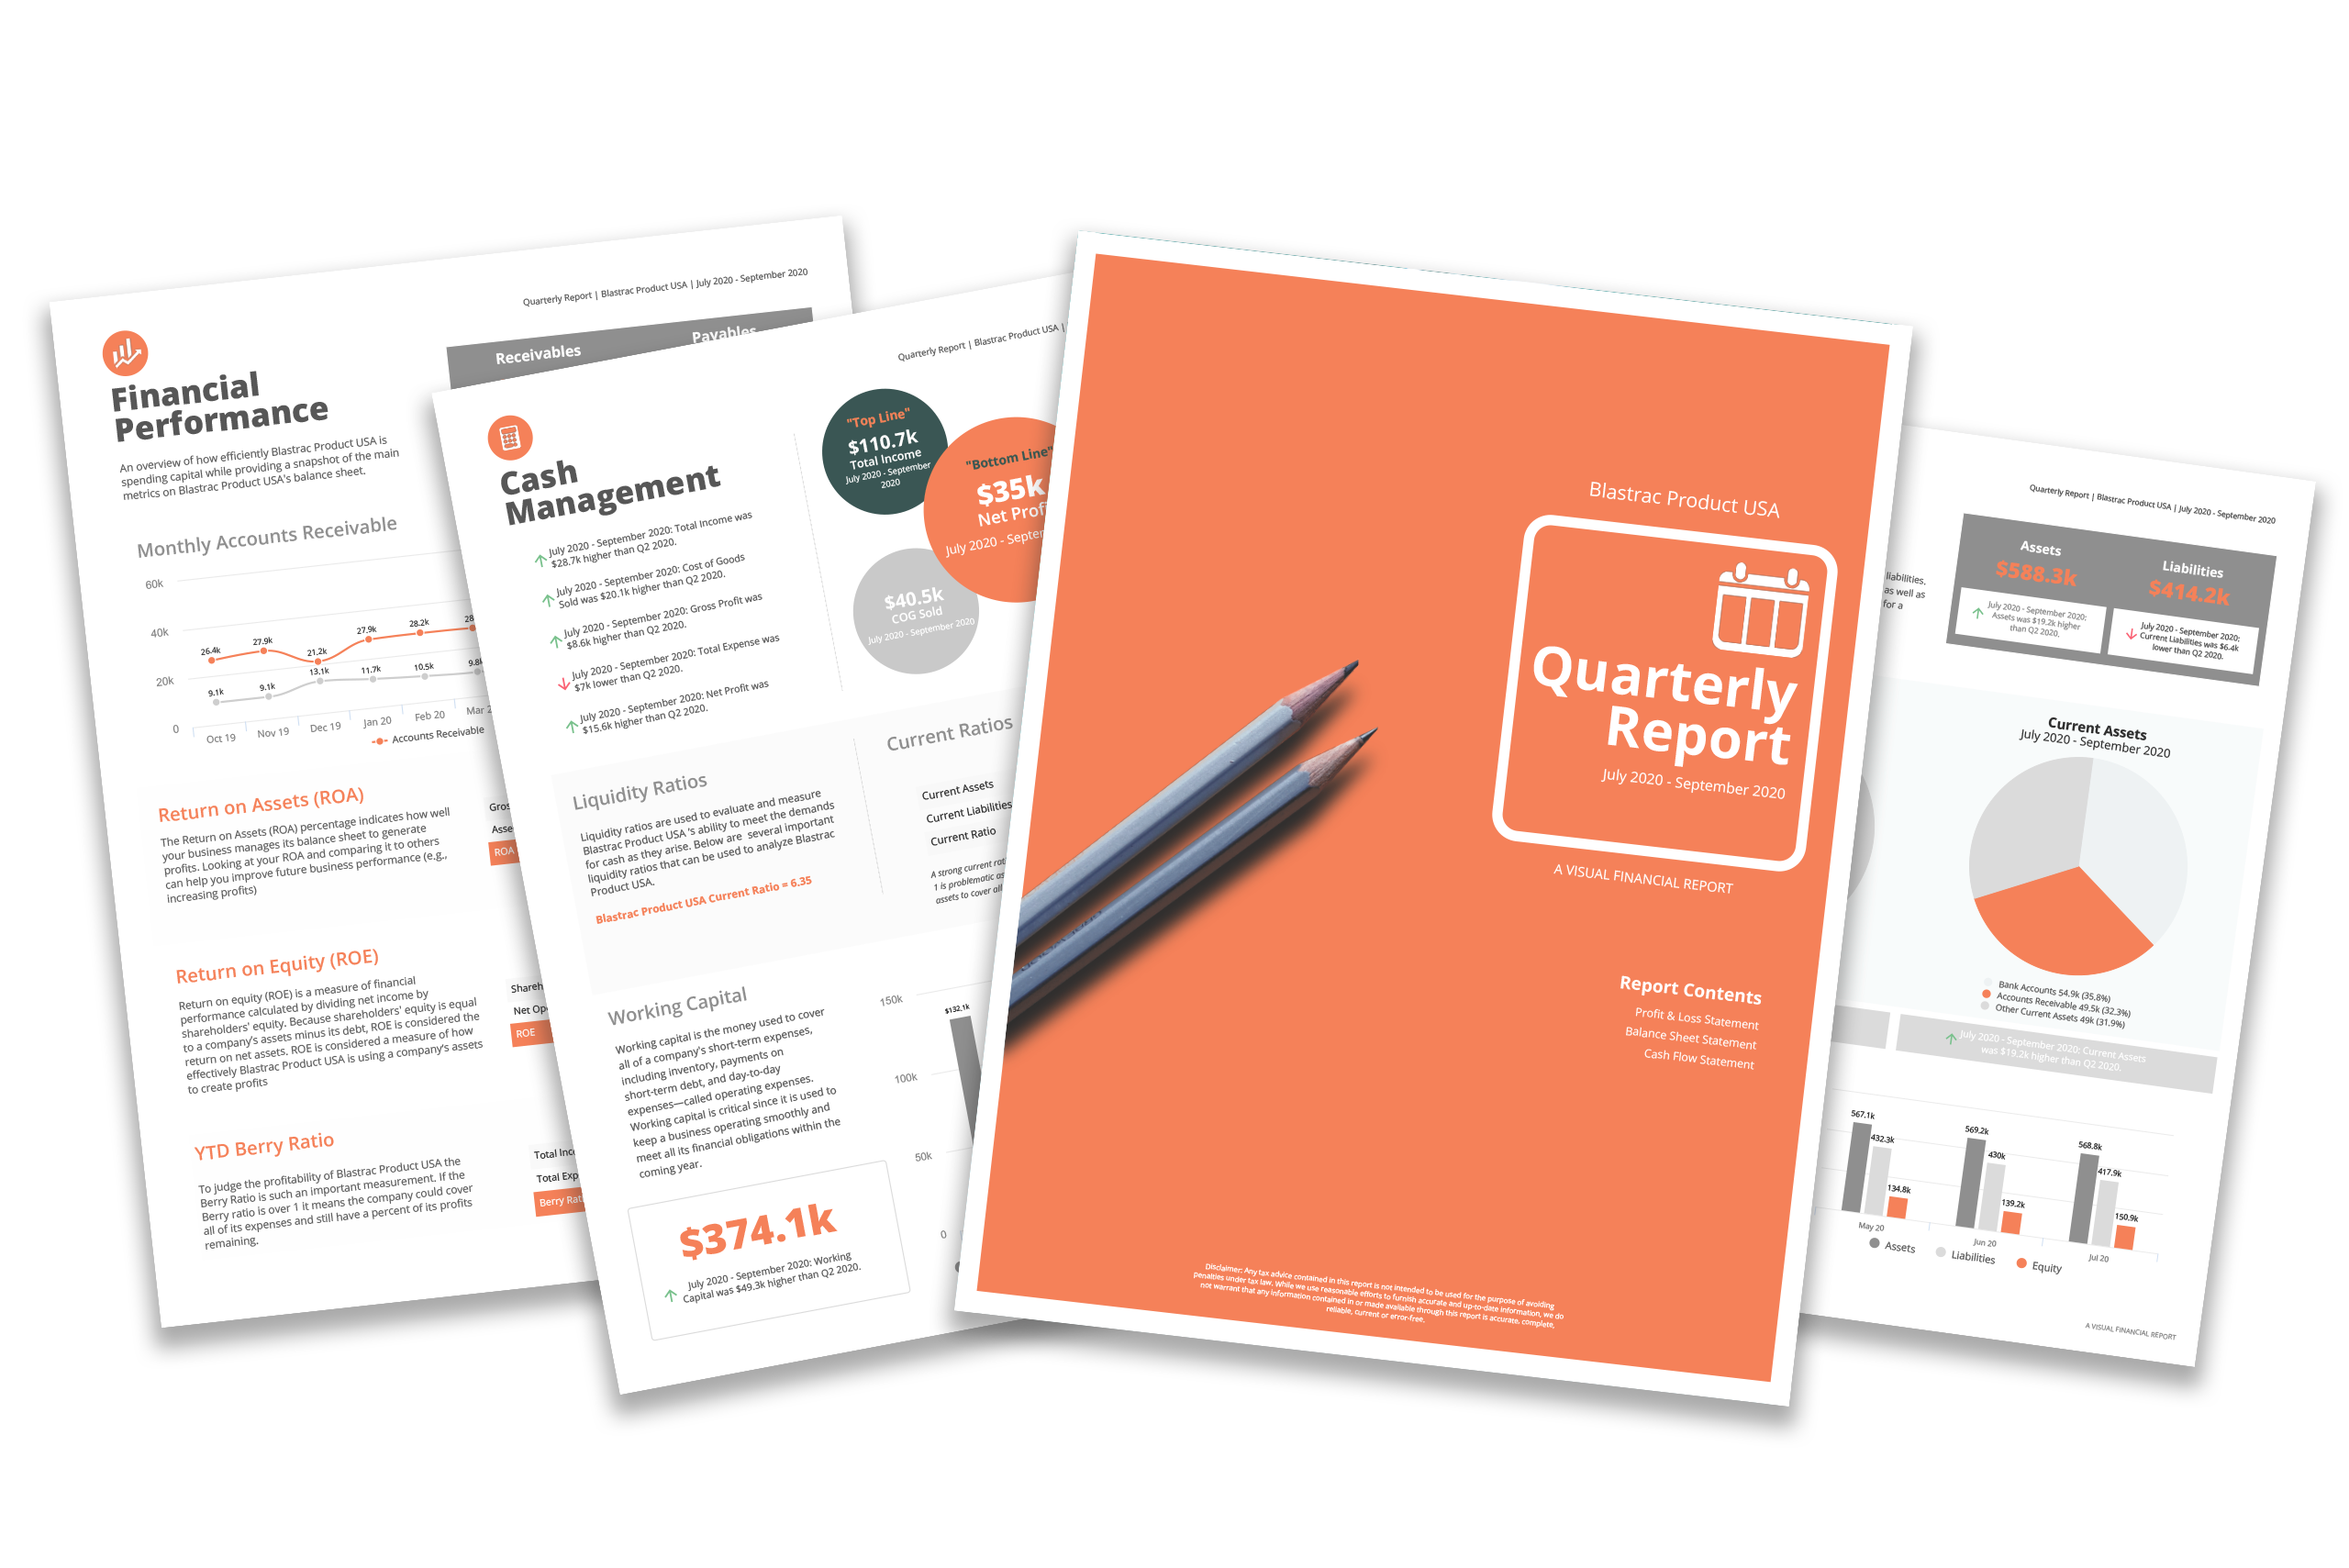
Data Visualization Like You Have Never Seen
Dynamically updated reports, budgets, and dashboards as data flows in.

Familiar spreadsheet environment
Automate reporting with the flexibility and familiarity of a spreadsheet, just as you would see in Google Sheets or Microsoft Excel.

Live data, reports & dashboards
Reports and dashboards built with live data. Connect QuickBooks Online, QuickBooks Desktop, Xero, Gusto or other non-financial data from Google Sheets or use a spreadsheet to upload a CSV with Trial Balance data.

Reports built with your needs in mind
We make sure all the report templates are designed to exceed industry standards to serve your clients best. Instantly connect your client’s company and have reports auto-fill with their financial data. Pre-built reports don’t quite fit? Our tool gives you the flexibility to create the reports you want with data that resonates!

Easily share data with your clients
All your reports and dashboards can be easily shared with all of your clients. Not only can they be shared instantly, but dashboards and reports are made to scale on any device so you and your clients can view the data that matters. Anywhere, anytime.


