Save Time & Get More Clients
Don’t spend your time creating the same report month after month. Let us automate that for you.

Tools Made for Advisors
Connect with your clients and let us handle the boring stuff.
LIVE TEXT
POWERFUL SHEETS
VISUAL METRICS
DYNAMIC REPORT TEMPLATES
WORKABLE STATEMENTS
SHARE ANYTIME, ANYWHERE
UNDERSTANDING DATA IS CRITICAL
Become your client’s financial Hero!
The Best Visual Reports
Connect. Select. Share.
Custom Dynamic Templates
What do you want? Pre-built dashboards and reports? Or do you want to build something truly custom? Want to show the relationship between the cash on hand and expenses? What about marketing spend relative to the PPC revenue? Your ability to get granular data can spell the difference for your clients as they guide their business.
Live, actionable, and beautiful data streams. Turn all your work into a template that will magnify your work!

Template Library
The library is updated with new templates monthly providing a wide range of auto-populated reports, spreadsheets, metrics, and statements that help you quickly display actionable information.
Share Custom Templates
Easily manage your templates and share them with your other clients. Reach isn’t just a report builder; it’s a financial storytelling system.
Auto-populate
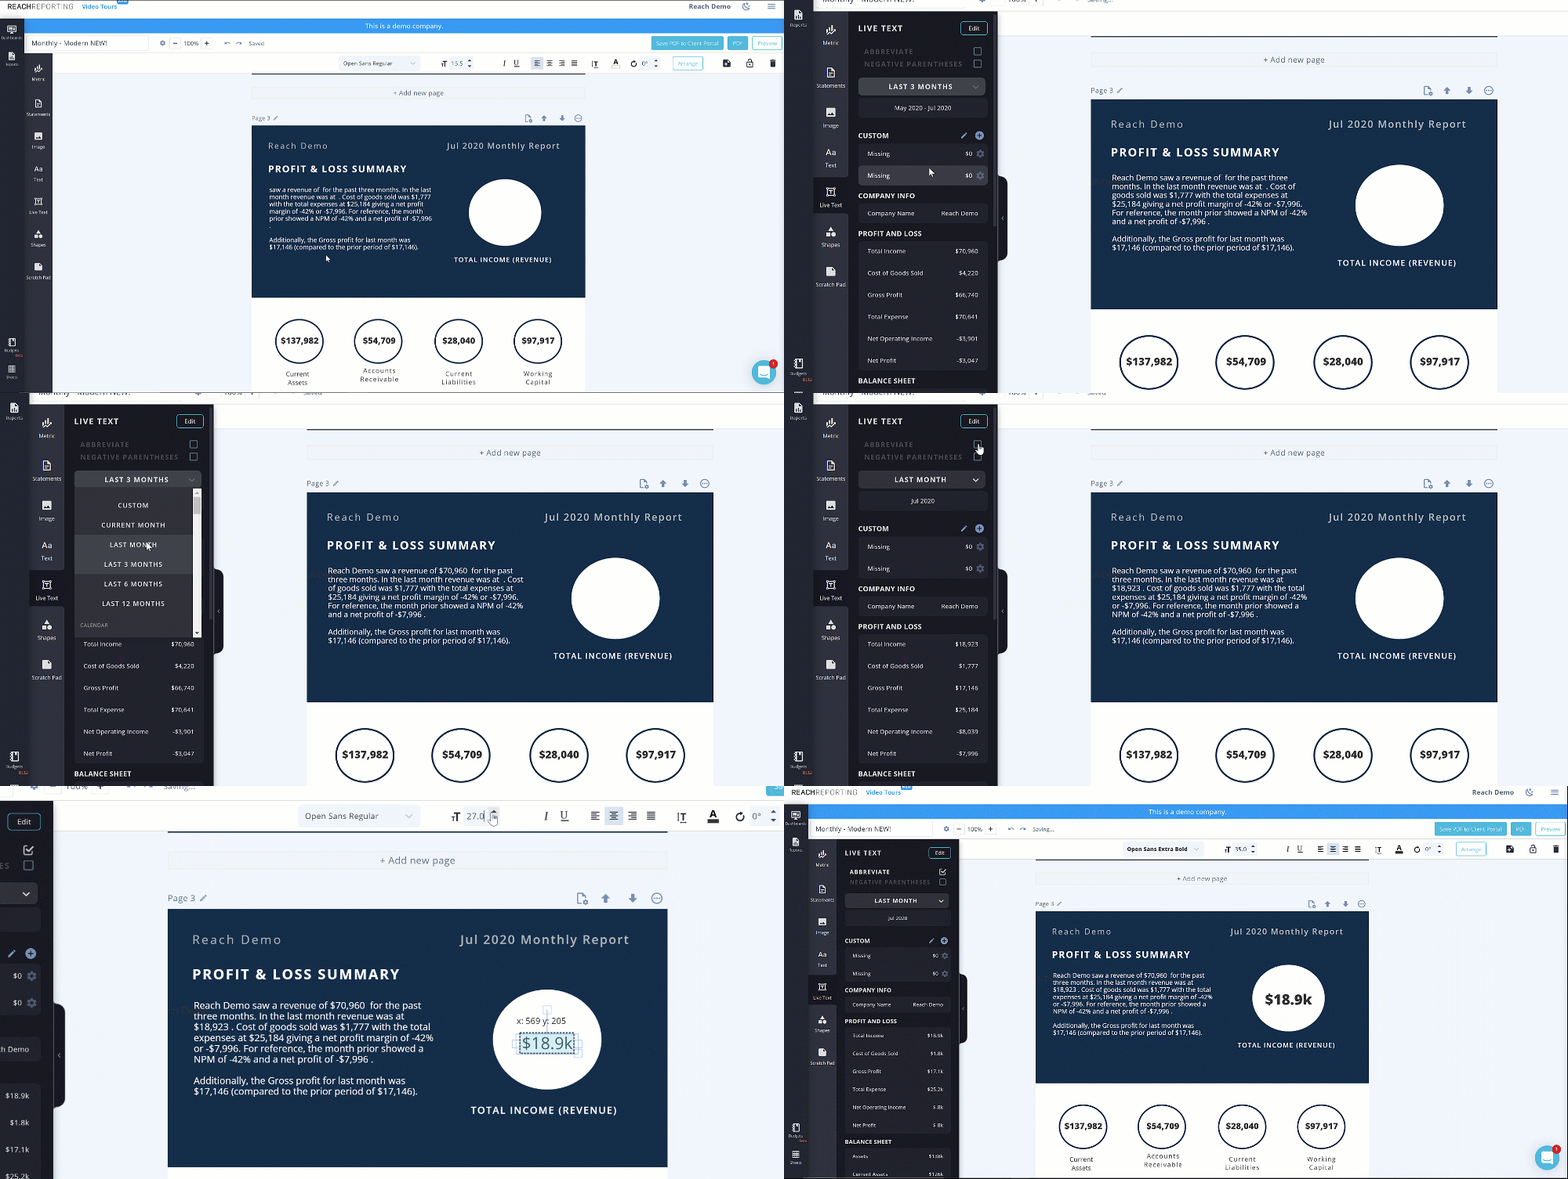
Add live-text anywhere in your reports. Connect a company and the template will pull live-data from your accounting software! Creating reports has never been this easy.
Build, Save and Manage
Build as many custom reports, spreadsheets, or metric templates as you want. Simply reuse them to jump-start new reports. Create custom spreadsheets with advanced formulas.
Take it for a spin. 30-days on us.

LIVE TEXT
Put Live Data Anywhere
Dynamically integrate data from your accounting software, and put it anywhere in your report. Save the report as a template and connect it to any company to automatically pull and produce the right story with the right numbers.
Game changer.
VISUAL METRICS
Custom or Templates
Reach Reporting’s visual metric tool pulls data directly from your accounting software ensuring you’re telling the right story with the most current data, always! Quickly build a visual metric or choose from several powerful templates. Save your custom metric as a template and use it for all of your reports.
WORKABLE STATEMENTS
Building Statements Just Got Real
Quickly pull data from your accounting software to display Profit and Loss, Balance Sheet, Cash Flow Statements, and more to your reports. Reach further by adding additional rows and columns to implement custom equations and formulas that provide powerful insights.
CONFUSING DATA COSTS U.S. BUSINESSES $3 TRILLION PER YEAR
It’s the difference between a thriving or dying business.

POWERFUL SHEETS
Create Custom, Excel™-like Sheets with Live Data.
Stop manually inputting data! Your data is instantly available to the Datasheet tool in Reach Reporting. Select a date range you want to pull from and you can instantly build spectacular spreadsheets that never have to be rebuilt or manually populated again. Imagine the time you will save! Now, turn those sheets into visual metrics.
DYNAMIC REPORT TEMPLATES
Use Ours or Create Your Own.
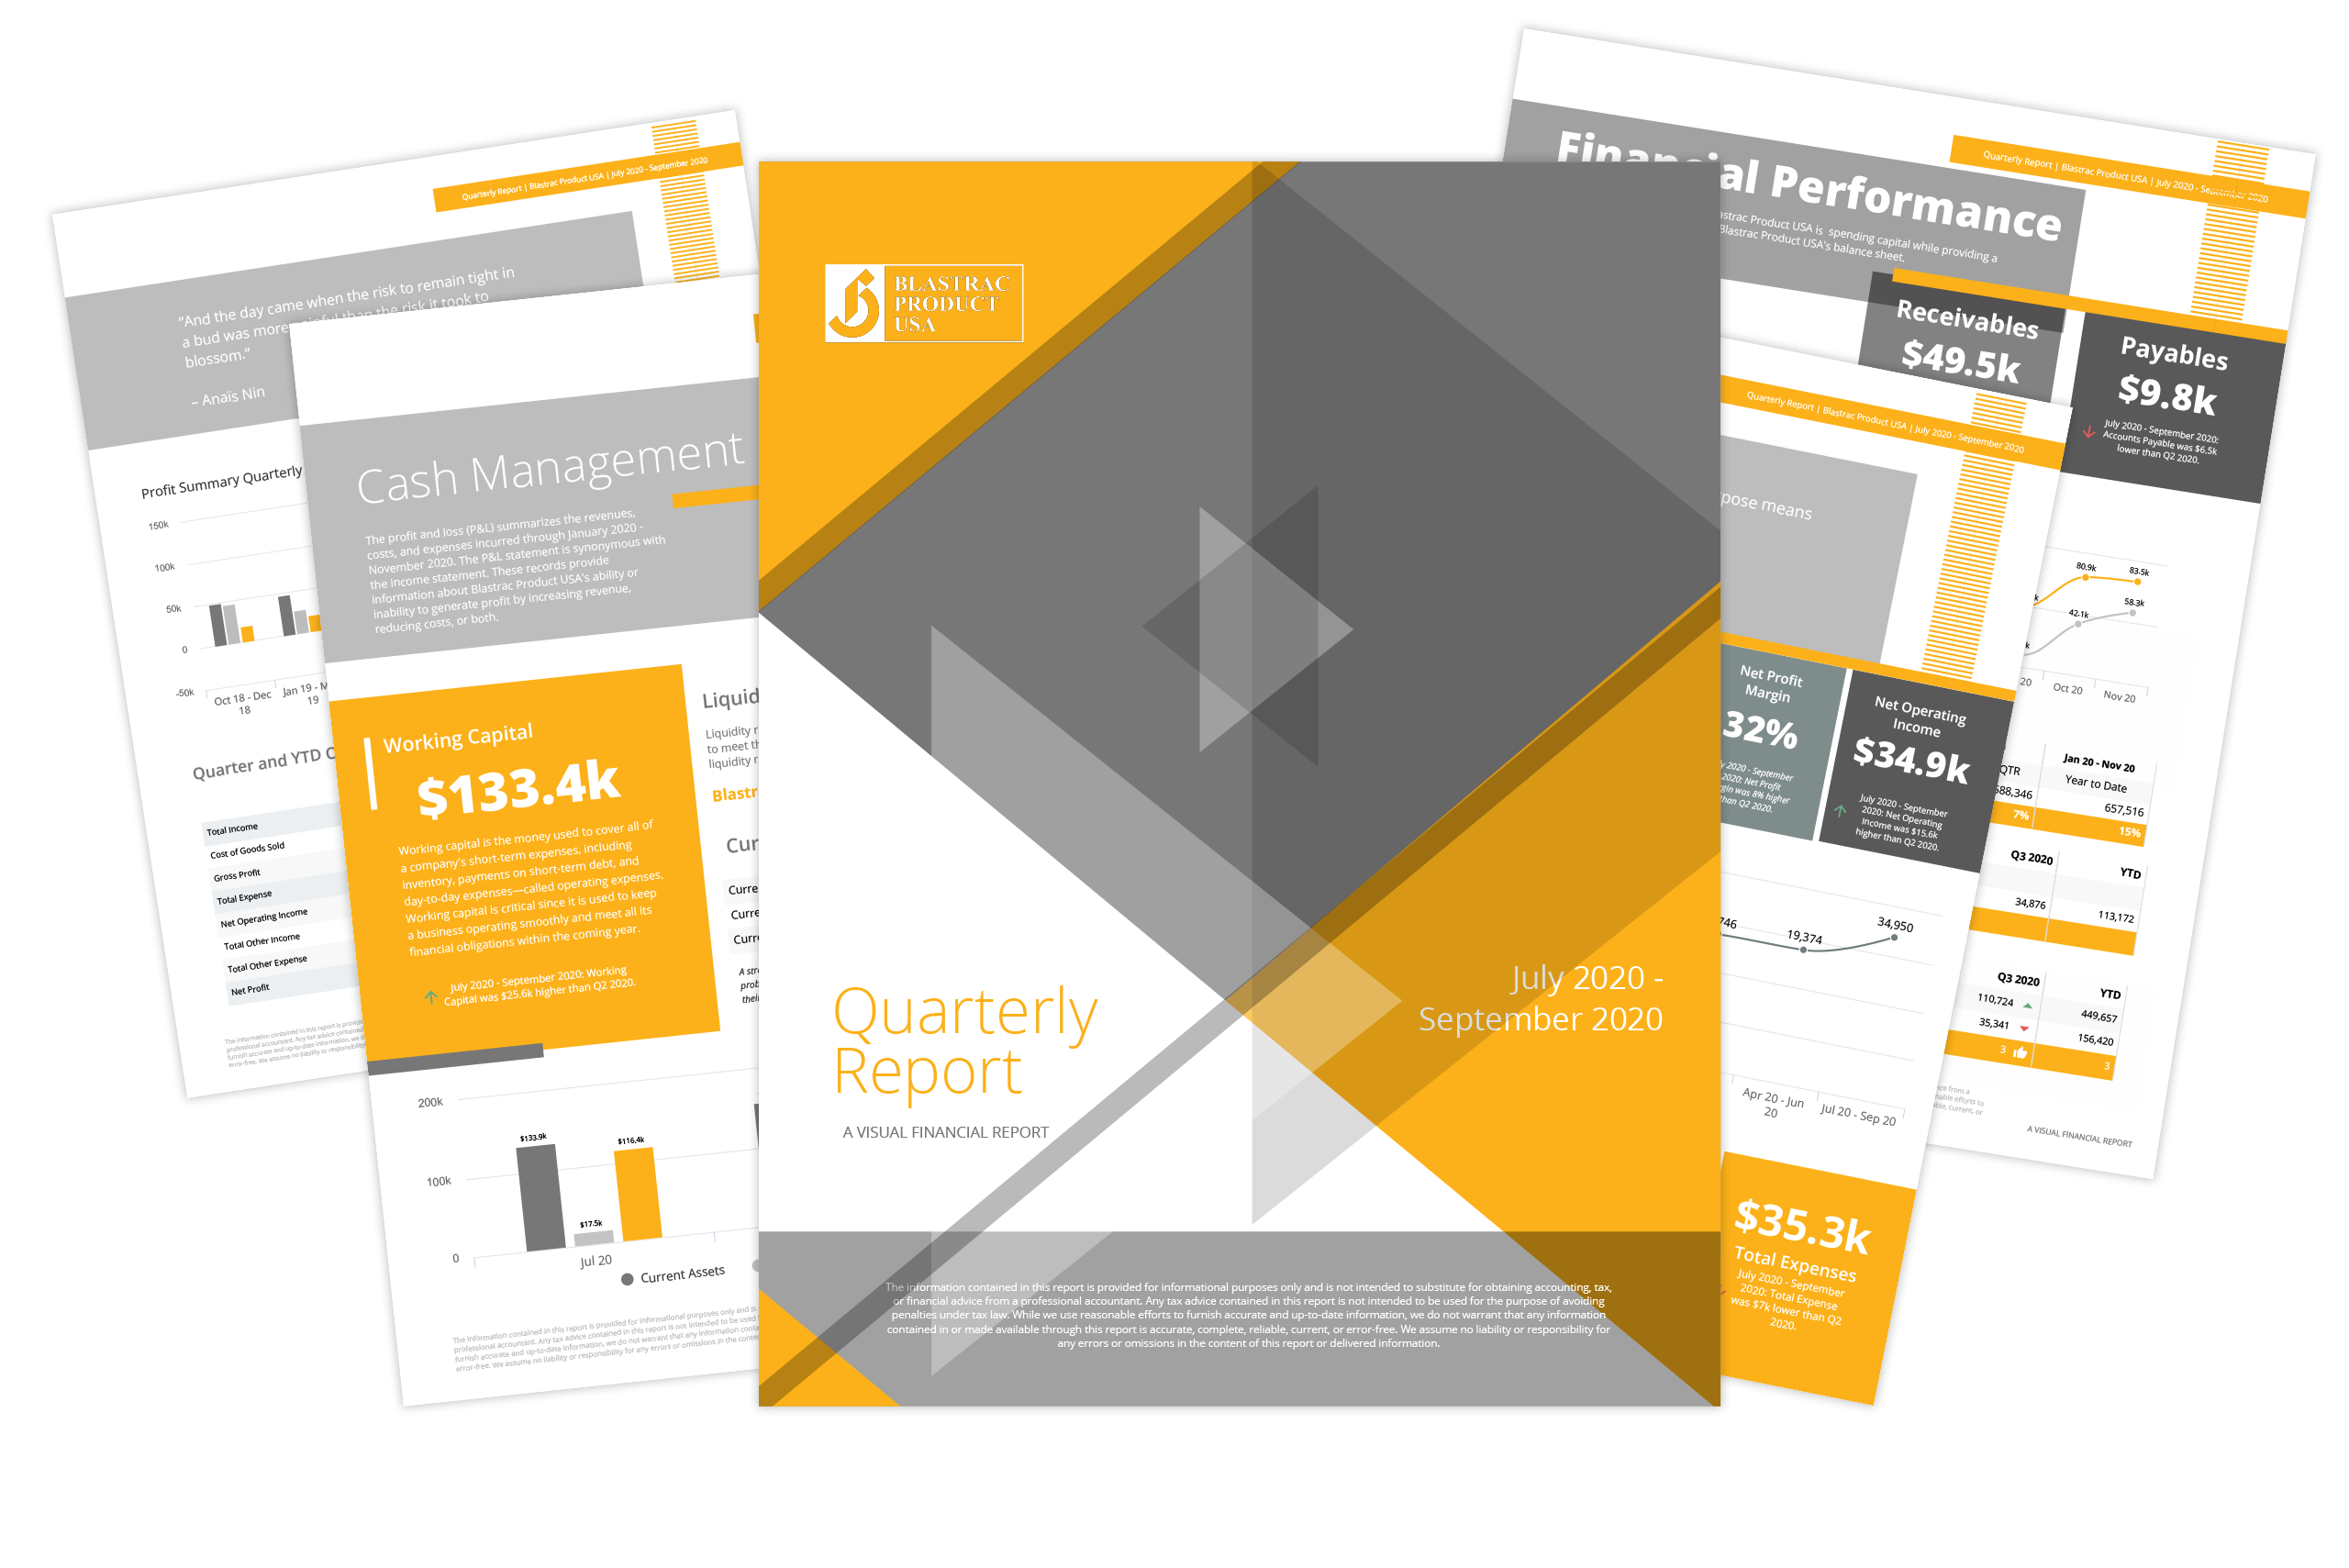
Communicate financial insights to business decision-makers with simple, yet comprehensive, visual reports that will unlock profitability, rapid scaling, and decrease waste.
DYNAMIC REPORT TEMPLATES
Use Ours or Create Your Own.
Communicate financial insights to business decision-makers with simple, yet comprehensive, visual reports that will unlock profitability, rapid scaling, and decrease waste.


